Дізнайтеся, як живі діаграми архітектури програмного забезпечення, модель C4 і підхід «діаграми як код» пришвидшують розробку, полегшують онбординг і підвищують підтримуваність.
January 9, 2026 (7mo ago) — last updated July 24, 2026 (1mo ago)
Software Architecture Diagrams: Best Practices
Дізнайтеся, як живі діаграми архітектури, модель C4 та діаграми як код пришвидшують розробку й підтримуваність.
← Back to blog
Software Architecture Diagrams: Best Practices and Tools
Summary: Дізнайтеся, як живі діаграми архітектури, модель C4 та підхід «діаграми як код» пришвидшують розробку, полегшують онбординг і підвищують підтримуваність.
Вступ
Дізнайтеся, як живі діаграми архітектури програмного забезпечення, модель C4 і підхід «діаграми як код» пришвидшують розробку, полегшують онбординг і підвищують підтримуваність. Правильно побудована діаграма стає єдиним джерелом істини для команд, спрощує технічне спілкування і підсилює можливості AI‑асистентів.
Що таке діаграма архітектури програмного забезпечення
An architecture software diagram is a visual blueprint for your software system. It lays out the core components, shows how they’re wired together, and explains how they interact. Think of it as the master plan that keeps development on track, clarifies communication, and ensures the system works as intended.
Чому сучасні команди потребують «живої» діаграми
Too many architecture diagrams gather digital dust in a wiki and fall out of sync with the codebase. A living diagram that’s kept up to date becomes a strategic tool: it shortens onboarding, reduces ambiguity, and serves as a single source of truth for everyone from new engineers to senior stakeholders.
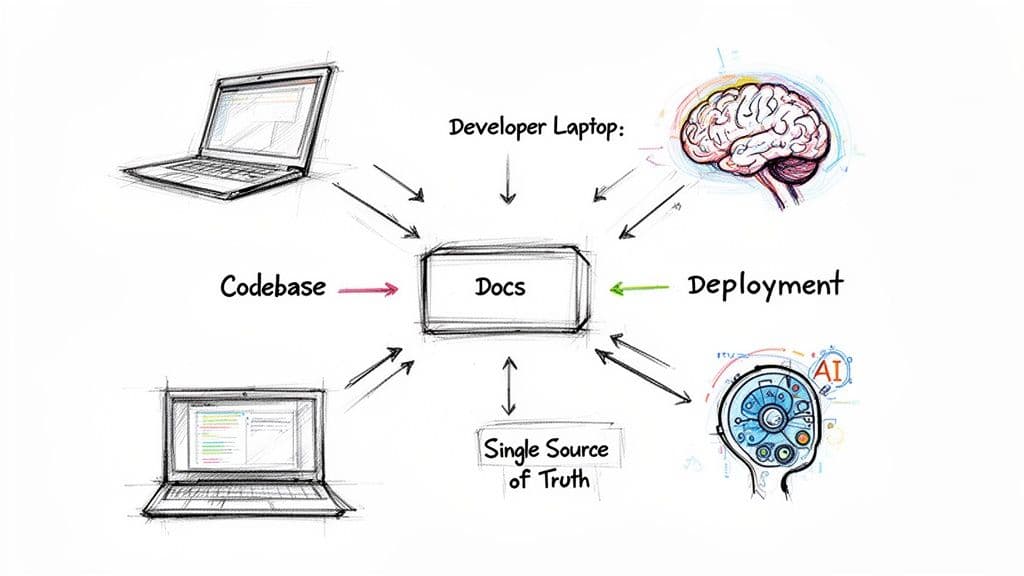
Розв’язання ключових проблем розробки
A clear diagram addresses common frustrations:
- Documentation drift: The code changes, but the diagram doesn’t. A living diagram that evolves with the codebase stops this.
- Painful onboarding: New engineers often spend weeks piecing together how a system works. A good diagram slashes ramp‑up time and gets new hires contributing sooner.
- Clunky collaboration: Without a shared visual map, system conversations devolve into assumptions, leading to poor technical decisions.
“A great architecture software diagram doesn’t just show what was built; it guides what to build next.”
This clarity matters for human teams and for AI‑assisted development tools. When AI tooling can access up‑to‑date architecture context, it can make far more accurate suggestions for refactors, feature work, and bug fixes.
Practical applications of this approach include backend projects such as lifepurposeapp.com, microestimates.com, and fluidwave.com, where diagrams helped keep codebases clean and maintainable.
At scale, investing in modern architecture diagrams pays off in speed, clarity, and quality.
Визначте обсяг і нотацію перед малюванням
Before you draw a single box or arrow, decide what you’re trying to communicate and who the audience is. The level of detail for a nontechnical stakeholder differs from what an engineer needs for a deep refactor. Trying to make one master diagram for every audience often produces clutter.
Використовуйте модель C4 для ясності
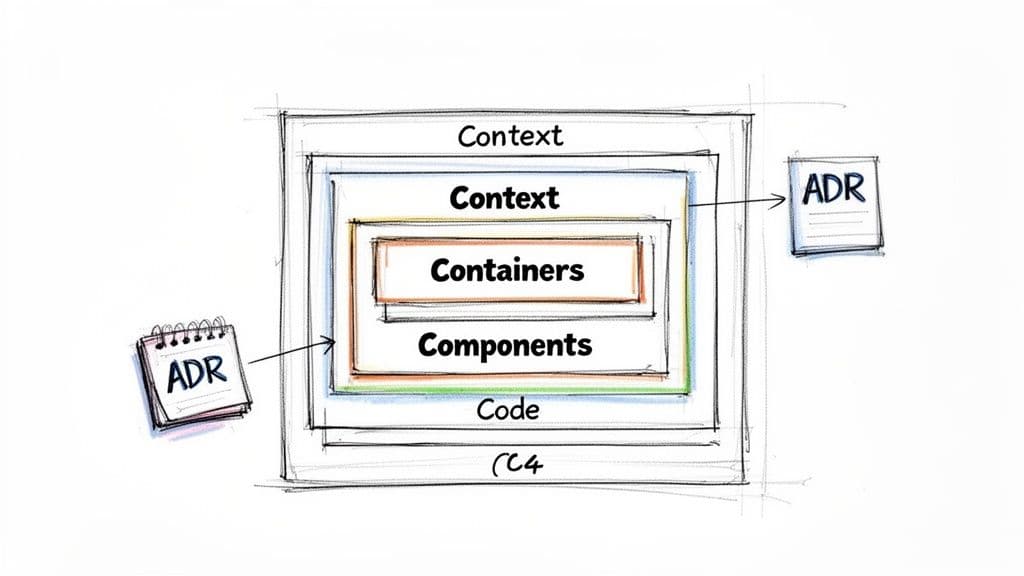
The C4 model provides four levels of abstraction so you can tailor diagrams to the discussion at hand: Context, Containers, Components, and Code.
Quick overview:
- Level 1: Context — A 10,000‑foot view showing the system as a single box and its external interactions. Good for executives and product managers.
- Level 2: Containers — Shows deployable units (web apps, APIs, databases) and technology choices. Ideal for architects and lead developers.
- Level 3: Components — Internal building blocks inside a container. For developers working in that service.
- Level 4: Code — Implementation‑level details; often left to the IDE rather than static diagrams.
C4 gives you a hierarchical map so you can start with a Context diagram and zoom into Containers and Components as needed.
Вибір рівня C4
| C4 Level | Primary audience | Purpose | Example use case |
|---|---|---|---|
| Context | Non‑technical stakeholders | Show the system’s role and interactions | Onboarding a new product manager |
| Containers | Architects, dev leads | Show high‑level structure and tech choices | Planning a cross‑service feature |
| Components | Developers | Show internal design of a service | Designing modules for a new microservice |
| Code | Individual devs | Implementation details | Inspecting class relationships in an IDE |
Choosing the right level is an act of empathy for your audience. A well‑scoped diagram respects their time and gives them exactly what they need.
Recent market analysis highlights rapid growth in diagramming and collaboration tools, driven by demand for cloud collaboration and integrated documentation workflows1.
Документуйте «чому» через ADR
Diagrams show the what and how; Architecture Decision Records (ADRs) document the why. An ADR is a short text file capturing a single architectural decision, its context, and consequences. Linking C4 diagrams to ADRs creates documentation that’s both a snapshot and a living history—helpful when a developer asks why PostgreSQL was chosen over MongoDB, for example2.
See our guide on architectural design software for more on combining diagrams and decision records.
Вибір інструментів для спільної роботи над діаграмами
Your diagram is only as good as the tool you use to build and maintain it. Stale diagrams often come from desktop tools that drift from the codebase. To keep documentation useful, choose tools that support collaboration, version control, and automation.
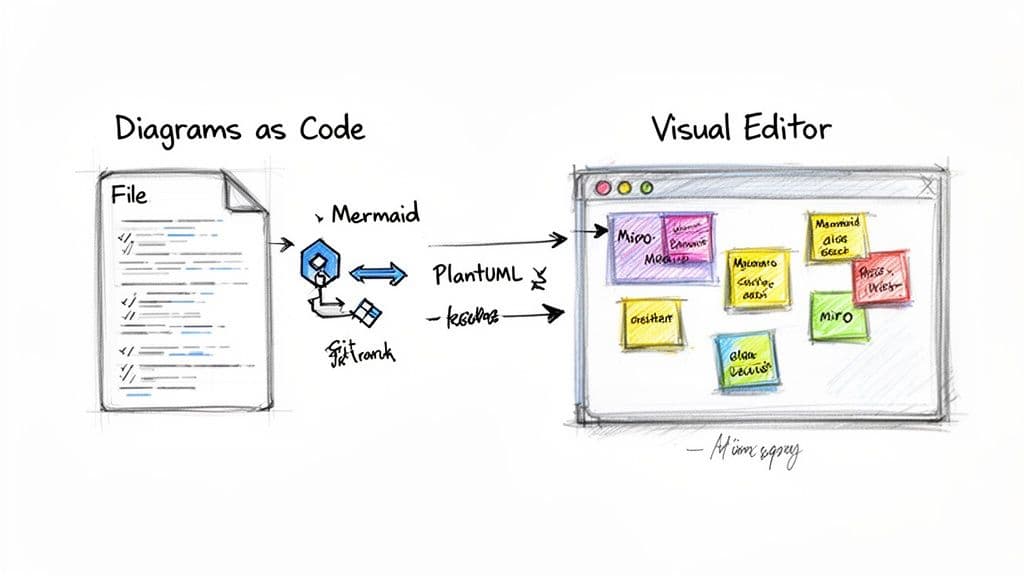
Text‑based diagram sources render to visual output. This “diagrams as code” approach is a game‑changer because it lets documentation live inside your Git repository and evolve with the code.
Злет «діаграм як код»
“Diagrams as code” treats visuals like any other software artifact. Instead of dragging shapes in a GUI, you define diagrams in text files and check them into Git. Advantages:
- Version control: Every change is tracked.
- Code review: Architectural changes can go through pull requests.
- Automation: Text files render automatically in CI/CD.
Tools like Mermaid and PlantUML are popular choices and have strong community adoption4.
Порівняння філософій інструментів
| Tool category | Pros | Cons | Best for |
|---|---|---|---|
| Visual editors (Miro, Lucidchart) | Intuitive for non‑devs; great for brainstorming | Often disconnected from code; poor versioning | Cross‑functional ideation and stakeholder workshops |
| Diagrams as code (Mermaid, PlantUML) | Lives in Git; enables automation and PR reviews | Steeper learning curve for non‑devs | Engineering teams who want living docs |
| Hybrid tools (Structurizr) | Code‑based model with visual tooling; generate multiple views | More complex to set up | Teams committed to C4 and centralized architectural docs |
The best tool is the one your team will actually use. Start small—try diagrams as code on a single service before rolling it out more broadly1.
Впровадження діаграм у щоденний робочий процес
A diagram is only useful if it’s accurate. Make diagrams a living part of your codebase by storing source files (.puml, .mmd) in Git so changes and diagrams can be reviewed together.
Робіть діаграми частиною репозиторію
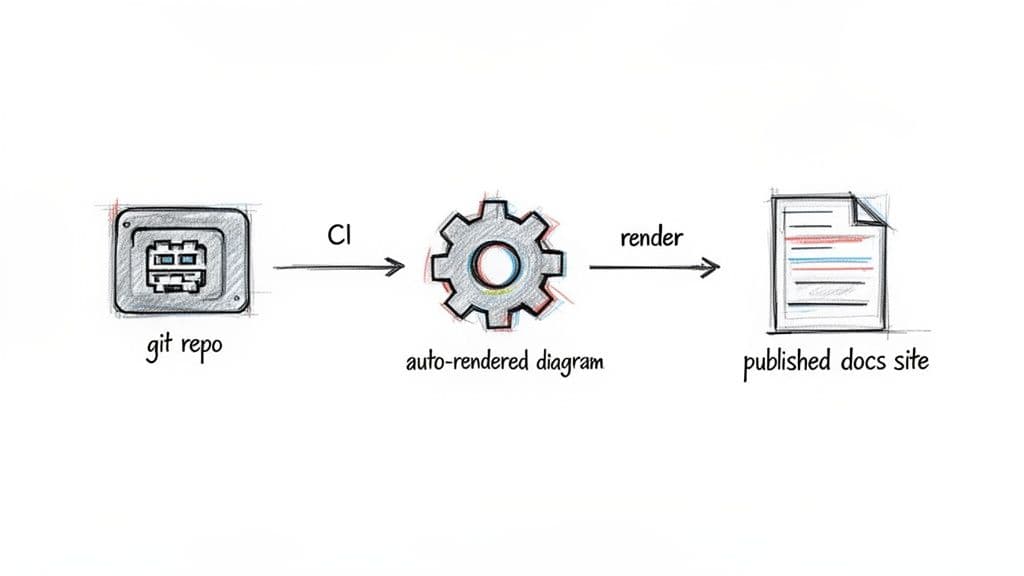
Commit diagram source files directly into your repo. When you change architecture, include the diagram update in the same pull request. This review loop keeps diagrams synchronized with code.
Автоматизація рендерингу через CI/CD
Add a CI job to render and publish diagrams when changes are merged to main:
- Commit and push updated diagram source.
- CI runs and renders images (SVG/PNG).
- Publish visuals to your docs site or wiki.
This ensures published diagrams are never far out of date and turns documentation into an automated by‑product of development.
Розширення можливостей AI за допомогою версіонованих діаграм
Version‑controlled diagrams are machine‑readable context for AI tools. When AI can parse current architecture, it can suggest smarter refactors, generate components that fit existing patterns, and make more accurate bugfix recommendations.
Treat diagrams as a core, version‑controlled asset to empower both human developers and AI assistants, as applied on projects such as microestimates.com and fluidwave.com.
Як уникнути того, щоб діаграми стали цифровим пилом
Creating a diagram is the easy part—keeping it relevant is the challenge. Common issues include overly detailed diagrams, inconsistent notation, and documentation drift. These are solvable with a few smart practices.
Анти‑патерни, яких слід уникати
- Information overload: Don’t cram every detail into a single diagram—it becomes unreadable and hard to maintain.
- Inconsistent notation: Agree on a visual language so diagrams aren’t ambiguous.
- Documentation drift: Keep diagrams and code in the same workflow so they evolve together.
Best practices to keep diagrams current
- Establish clear ownership: Assign an owner for each important diagram.
- Make reviews lightweight: Include diagram updates in PRs when code changes affect structure.
- Embrace automation: Use diagrams as code and CI to render and publish visuals automatically.
A diagram’s value is measured by its continued relevance. The goal is documentation that evolves with your system and remains a trustworthy map for your team. Several public‑sector programs now mandate graphical architectural diagrams as core resources for managing large IT portfolios, underscoring how critical this discipline is at scale5.
Часті питання — швидкі відповіді
Як часто оновлювати діаграми архітектури?
Treat diagrams like code. Update them in the same pull request as any significant architectural change. For active projects, expect updates every few weeks, and review key diagrams during sprint planning or retrospectives.
У чому різниця між діаграмою системної архітектури і UML?
UML is formal and detailed—class, sequence, and activity diagrams for implementation. A system architecture diagram (C4) is high level and communication focused. Use C4 for big‑picture discussions and UML for deep technical design.
Як отримати згоду команди на підтримку діаграм?
Show direct benefits: faster onboarding, safer refactors, better AI assistance, and clearer communication with product and stakeholders. Start with one critical service, keep its diagram current, and let results sell the practice.
Коротке Q&A — відповіді на типові питання
Q: What’s the fastest way to stop documentation drift? A: Store diagrams in Git, require diagram updates in PRs, and automate rendering in CI.
Q: Which C4 level should I start with? A: Start with a Container diagram (C4 Level 2); it balances detail and clarity for most engineering teams.
Q: Are diagrams as code worth the effort? A: Yes, if you want living documentation that’s versioned, reviewable, and automatable.
1.
Grand View Research, “Diagram Software Market Size, Share & Trends Analysis Report,” 2020. https://www.grandviewresearch.com/industry-analysis/diagram-software-market
2.
adr.github.io, “Architecture Decision Records (ADR)”—community guide and patterns. https://adr.github.io/
3.
Market analysis reporting increased demand for cloud‑based diagramming and collaboration tools; see Grand View Research market overview for context. https://www.grandviewresearch.com/industry-analysis/diagram-software-market
4.
Mermaid.js documentation and community resources. https://mermaid.js.org/
5.
California Department of Technology, Enterprise Architecture program—graphical diagrams as fundamental resources. https://cdt.ca.gov/
🙋🏻♂️
ШІ пише код.Ви робите його довговічним.
В епоху прискорення ШІ чистий код — це не просто хороша практика — це різниця між системами, які масштабуються, та кодовими базами, які руйнуються під власною вагою.