An architecture system diagram is the blueprint of your software. This guide shows how to design clear, versioned diagrams—using C4, diagrams-as-code, and CI automation—so teams stay aligned and onboarding speeds up.
January 2, 2026 (3mo ago) — last updated April 30, 2026 (Today)
Architektur-Systemdiagramme, die wirklich genutzt werden
Create clear, versioned architecture diagrams with C4, diagrams-as-code, and CI to improve team alignment and speed onboarding.
← Back to blog
Architektur-Systemdiagramme, die wirklich genutzt werden
Learn how to design clear, maintainable architecture system diagrams. This guide covers notation, tooling, versioning, and practical best practices for modern software teams.
Einführung
An architecture system diagram is the blueprint of your software. It explains core components, how they connect, and the data flows between them. A good diagram reduces complexity, aligns teams around a single source of truth, and speeds onboarding and decision making.
Warum ein Diagramm mehr ist als nur Kästchen und Linien
Too many teams treat diagrams as a one-and-done artifact drawn at kickoff and never updated. A great diagram is a living document and a strategic asset that delivers daily value.
From consulting engagements, a clear diagram is often the difference between a project that scales and one that collapses under complexity. It’s not just drawing boxes; it’s creating shared understanding across the team.
Beschleunigtes Onboarding und weniger Chaos
Imagine a new developer joining the team. Without a good diagram, their first weeks are a scavenger hunt through code, chat threads, and stale wiki pages. A well-maintained diagram flips that script. It answers the most pressing questions quickly:
- What are the main services we own?
- How do they communicate?
- Where does the data live?
- What key external dependencies exist?
This visual context helps new hires become productive faster and frees senior engineers for higher-value work. This matters for production-ready applications where understanding data and service flows is critical from day one.
Alt-Systeme ordnen und KI ermöglichen
Documenting a legacy system often uncovers hidden dependencies and risky coupling, and it gives you a clear path for refactoring or modernization. A clear diagram also helps AI-powered tools for code analysis and pair programming by providing structural context that makes suggestions more relevant.
Clear architectural diagrams are used in large-scale IT programs to improve alignment and reduce delivery times1. They also helped regional planning projects reduce integration problems in pilot areas2.
Notationswahl: C4 versus UML
Choosing a notation is about audience and purpose. The two common options are UML and the C4 model.
UML: die Sprache der Präzision
UML (Unified Modeling Language) ist formal und ausdrucksstark. Es gibt viele Diagrammtypen für präzise, granulare Entwürfe wie Klassendiagramme, Sequenzdiagramme und Deployment-Views. UML ist ideal, wenn Sie detaillierte technische Spezifikationen brauchen, kann aber für nicht-technische Stakeholder zu dicht sein.
C4: die Sprache der Kommunikation
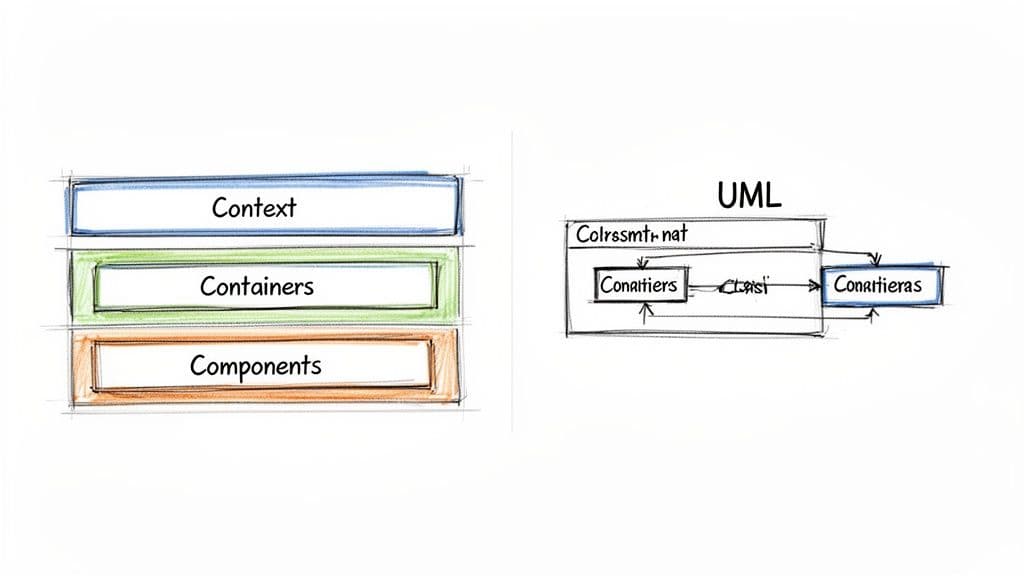
The C4 model, developed by Simon Brown, is built for clarity and layered communication3. Its four zoom levels make it easy to tailor the diagram to the audience:
- Level 1: Context — the 10,000-foot view showing users and external systems.
- Level 2: Containers — the deployable building blocks like web apps, APIs, and databases.
- Level 3: Components — the key modules inside a container.
- Level 4: Code — an optional mapping to classes or functions.
C4 lets you start conversations with non-technical stakeholders on the Context view and then dive into Containers or Components for engineering discussions. For many web applications, C4 is the pragmatic choice.
“The goal isn’t just technical correctness; it’s broad understanding.”
Diagrammumfang richtig setzen: vom Kontext bis zum Code
One common mistake is the “everything diagram”: a single chart that tries to show every user, service, table, and call. The result is unreadable.
A better approach is a hierarchy of focused diagrams at different levels of abstraction. The C4 model is perfect for this: think of a set of maps from bird’s-eye view down to street-level code.
Let’s walk through a C4-style hierarchy for a SaaS tool built on React and Node.js to make this concrete.
Level 1: System Context
Start with a simple System Context diagram. Show the system as one box and the external actors and systems it interacts with. For example, a project-estimation app might show:
- Users: Project Manager
- System:
microestimates.comapplication - External dependencies: Payment Processor (Stripe) and Email Service (SendGrid)
This view is ideal for product managers and non-technical stakeholders. For more on C4 context views, see the C4 model guide in our internal docs: /guides/c4-model.
Level 2: Containers
The Container diagram opens the box to show major deployable components. For a React + Node.js example:
- React Web Application — the single-page app in the browser.
- Node.js API Server — business logic, auth, and APIs.
- PostgreSQL Database — persistent storage.
Show the communication lines: React → API → Database. This view clarifies how the system is actually composed and helps planning deployment and scaling.
Level 3: Components
Zoom into a container to show key logical modules. For the Node.js API server, you might diagram:
- Authentication Controller
- Estimates Service
- Billing Gateway
- Data Access Layer
Component diagrams map closely to the codebase and help new developers find where responsibilities live. Keep components focused and name them after responsibilities, not implementation details.
Diagramme aktuell halten mit modernen Tools
The biggest enemy of a diagram is time. Whiteboard sketches are quickly out of date, becoming “ghost diagrams.” Treat diagrams like code so they remain accurate.
Diagrams as code
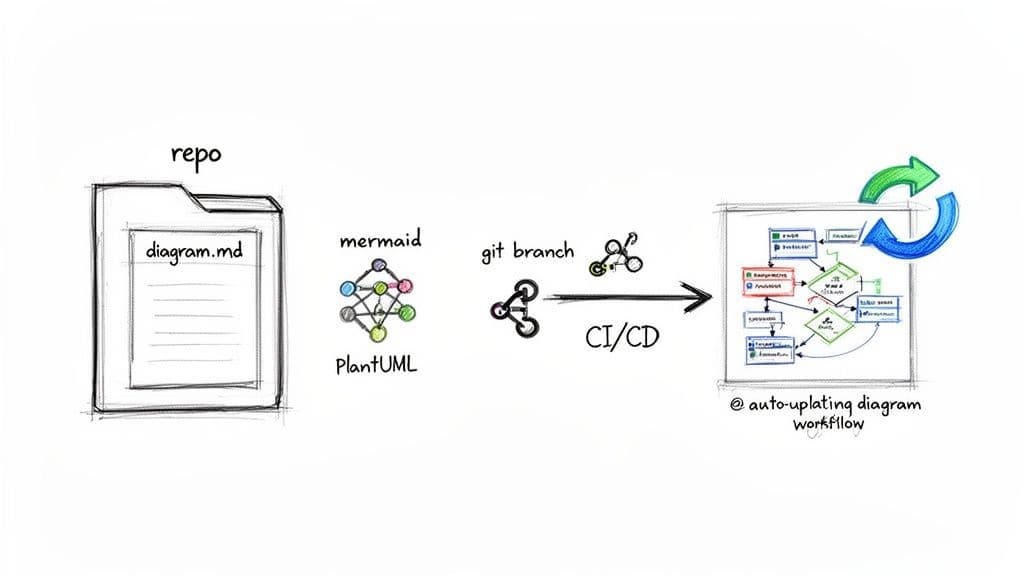
Tools like PlantUML and Mermaid let you describe diagrams in text and version them in Git4. Store .puml or .mmd files next to your source code so diagram updates can be part of the same pull request that changes the architecture.
Developers consistently rank accurate documentation and clear architecture among the top factors for productivity and faster onboarding5.
Diagrams in den Workflow verweben
Automate diagram generation in CI/CD so documentation updates when code changes. A typical flow:
- A developer updates code and the diagram source file in the same PR.
- CI builds the diagram image from the text file.
- CI publishes the image to the project documentation site.
This keeps diagrams current without manual effort. For recommended CI patterns and examples, see our docs on documentation workflows: /docs/diagrams-as-code.
Das richtige Tool wählen
Use collaborative whiteboarding (Miro, Lucidchart) for early brainstorming and diagrams-as-code (PlantUML, Mermaid) for versioned, reviewable documentation. Start with a workshop sketch, then codify the agreed design in text so it’s reviewable and automatable.
Häufige Fallen vermeiden
Bad diagrams often start with good intentions. Watch for these anti-patterns.
The everything diagram
Trying to show everything leads to a noisy diagram. Create focused views at different abstraction levels instead.
The ghost diagram
An outdated diagram is worse than none. Treat diagrams like code, keep them in version control, and schedule documentation sprints to reduce documentation debt.
The notation nightmare
Mixing notations and symbols creates confusion. Pick a notation and stick with it. Document your legend so everyone reads diagrams the same way.
Häufig gestellte Fragen
Wie oft sollten wir Diagramme aktualisieren?
Update diagrams whenever the architecture changes. Include diagram edits in the same pull request as the code changes. High-level views may change quarterly; lower-level diagrams should be updated continuously.
Welches Diagramm eignet sich für Microservices?
Use layered diagrams: System Context (C4 Level 1), Container Diagram (C4 Level 2) for mapping microservices, and sequence diagrams (UML) for tracing complex interactions.
Wie bringen wir das Team dazu, Diagramme tatsächlich zu nutzen?
Make diagrams visible where people work, require relevant diagram links in PRs, and include them in new-hire day one material.
Drei kurze Q&A
Q: Warum in Architekturdiagramme investieren?
A: Sie verkürzen das Onboarding, decken versteckte Abhängigkeiten auf und verbessern die bereichsübergreifende Abstimmung, weil die Systemstruktur sichtbar wird.
Q: Welche Notation wählen?
A: Wähle die Notation nach Zielgruppe: C4 für Klarheit und abgestufte Kommunikation, UML wenn du formale technische Präzision brauchst.
Q: Wie halten wir Diagramme aktuell?
A: Behandle Diagramme wie Code: Quelltext in Git, Bildgenerierung in CI und Änderungen im selben PR wie den Code.
1.
California Enterprise Architecture Framework and related state efforts that emphasize standardized architecture practices and alignment. https://www.ca.gov/enterprise-architecture
2.
Southern California Association of Governments, SCAG Architecture Final Report, which documents integration efforts and benefits from standardized, living diagrams. https://scag.ca.gov/sites/default/files/2024-05/scag_architecture_update_final_report.pdf
3.
C4 model by Simon Brown. https://c4model.com
4.
Diagrams-as-code tools: PlantUML and Mermaid.js. https://plantuml.com and https://mermaid.js.org
5.
Stack Overflow Developer Survey and industry reports show that accurate documentation and clear architecture are consistently ranked among top productivity factors for developers. https://insights.stackoverflow.com/survey
🙋🏻♂️
KI schreibt Code.Sie lassen ihn bestehen.
Im Zeitalter der KI-Beschleunigung ist Clean Code nicht nur gute Praxis — es ist der Unterschied zwischen Systemen, die skalieren, und Codebasen, die unter ihrem eigenen Gewicht zusammenbrechen.