A software architecture diagram is the project’s blueprint: a visual map of major components, their relationships, and runtime behavior. Clear diagrams reduce technical debt, speed onboarding, and help non‑technical stakeholders understand tradeoffs. Treat diagrams as living artifacts to keep architecture aligned with code.
December 25, 2025 (6mo ago) — last updated May 4, 2026 (2mo ago)
Software Architecture Diagrams for Scalable Systems
Step‑by‑step guide to creating software architecture diagrams with C4, UML, and diagrams‑as‑code to build scalable, maintainable systems.
← Back to blog
Software Architecture Diagrams for Scalable Systems
A complete guide to creating software architecture diagrams that help teams build scalable, maintainable systems. Learn practical C4 views, UML patterns, diagrams‑as‑code workflows, and best practices to keep architecture aligned with code.
Introduction
A software architecture diagram is the project’s blueprint: a visual map of major components, their relationships, and runtime behavior. Clear diagrams reduce technical debt, speed onboarding, and help non‑technical stakeholders understand high‑level tradeoffs. Treating diagrams as living artifacts keeps architecture accurate and actionable across the lifecycle of a system.1
Think of Your System’s Architectural Blueprint
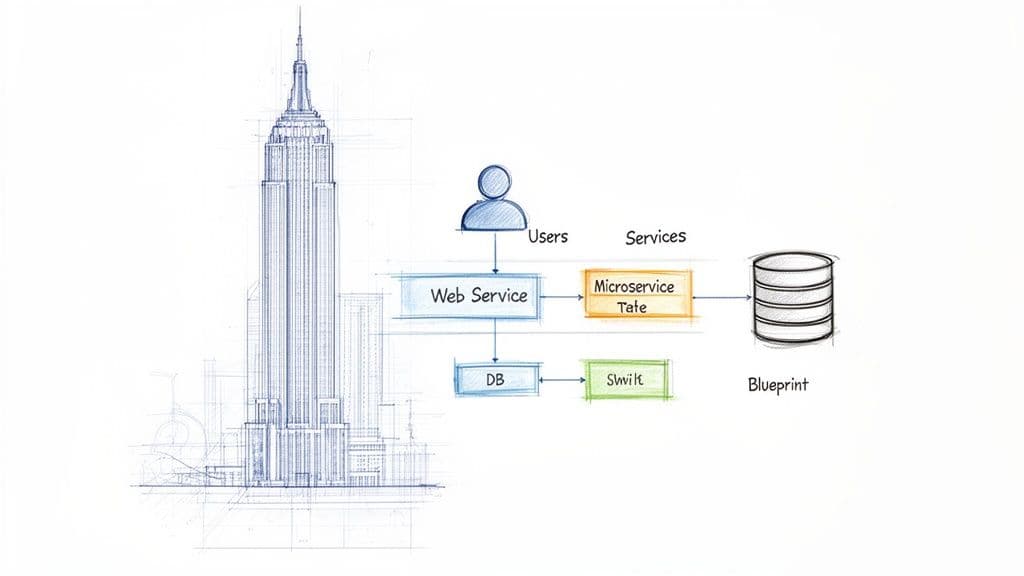
A software architecture diagram is the master blueprint for a software system. It visually shows the major pieces, how they fit together, and how they interact. This high‑level map guides development decisions and long‑term planning, helping teams build complex, scalable systems that last.
Why Every Project Needs a Blueprint
Without a clear architectural vision, teams accumulate technical debt. Small, isolated decisions create tangled dependencies and a brittle codebase. A well‑designed diagram prevents that by:
- Aligning the team with a shared mental model.
- Speeding onboarding so new developers learn the system quickly.
- Translating technical ideas for non‑technical stakeholders.
- Revealing bottlenecks and single points of failure before implementation.
“A software architecture diagram is more than just boxes and arrows; it’s a strategic asset.”
The diagramming market is growing, reflecting how essential visual system documentation has become1.
From Abstract Ideas to Concrete Plans
A software architecture diagram connects high‑level business goals to the technical work required to achieve them. It’s the foundational document that steers development and ensures complex applications are built on a solid framework. Clear architecture underpins reliable user experiences and sustainable engineering practices.
Navigating System Views with the C4 Model
One diagram can’t serve every audience or purpose. The C4 model gives four levels of detail so you can pick the right view for the right conversation: Context, Containers, Components, and Code.
Level 1: Context — The Satellite View
The Context diagram shows your system in its environment: who uses it and which external systems it talks to. It’s ideal for executives, product owners, and new team members who need a quick, non‑technical overview.
Example: An e‑commerce Context diagram shows the “Customer” and “Admin” users plus external services like a payment gateway and email provider.
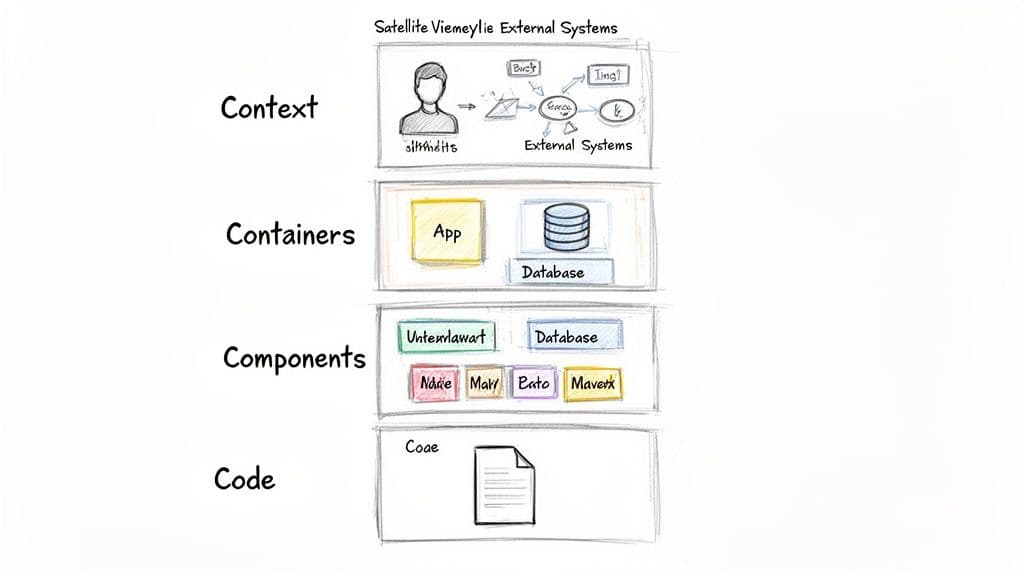
Level 2: Containers — The City Map
The Container diagram zooms in to show deployable parts of your system: web apps, mobile apps, databases, and microservices. It’s the go‑to view for developers and operations teams who need the high‑level technical layout.
Level 3: Components — The Street‑Level View
A Component diagram focuses on a single container and its internal modules: controllers, services, and data access layers. This view bridges architecture and code, guiding feature development and debugging.
Level 4: Code — The Floor Plan
The Code level shows implementation details, like UML class diagrams. These are best generated on demand by tools or IDEs, because keeping them up‑to‑date manually is impractical.
C4 Model Levels at a Glance
| Diagram Level | Purpose | Audience | Example Elements |
|---|---|---|---|
| Context | System in its environment | Everyone | Users, external systems, system as a single box |
| Container | Major deployable parts | Developers, architects, ops | Web apps, databases, APIs, microservices |
| Component | Internal modules inside a container | Developers on that container | Controllers, services, repositories |
| Code | Implementation details of a component | Developers needing deep detail | Classes, interfaces, methods |
The C4 model helps you tell the right story, at the right level, to the right people.
Choosing the Right Diagram for the Job
C4 is a practical framework, but sometimes you’ll need other notations. Ask: “What am I trying to explain, and to whom?” The answer determines the diagram type.
UML: A Classic, Detailed Language
UML provides precise diagrams—class diagrams for static structure and sequence diagrams for interactions. It’s great for engineering‑level discussions but can overwhelm non‑technical stakeholders.
Sequence Diagrams: Interactions Over Time
Use sequence diagrams to show step‑by‑step interactions between components. For example, a login flow might show the client sending credentials to the API, the API calling the auth service, the service checking the database, and the response returning to the user.
Deployment Diagrams: Where Code Runs
Deployment diagrams map components to runtime infrastructure: servers, cloud instances, or Kubernetes clusters. They’re essential for capacity planning, redundancy, and performance tuning.
Choosing the right diagram is about clarity, not complexity. Many teams favor container and context views but review diagrams infrequently—creating the risk of stale documentation2.
Matching Diagrams to Patterns
Certain patterns favor particular diagrams. For microservices, combine a C4 container view with sequence diagrams to trace cross‑service calls. For event‑driven systems, an events‑and‑brokers diagram explains decoupling more clearly than text.
Creating Diagrams That Evolve with Your Code
Diagrams become harmful when they drift from the codebase. Preventing “architectural drift” requires two habits: give each diagram a single focus, and include a clear legend so anyone can read it without a guided tour.
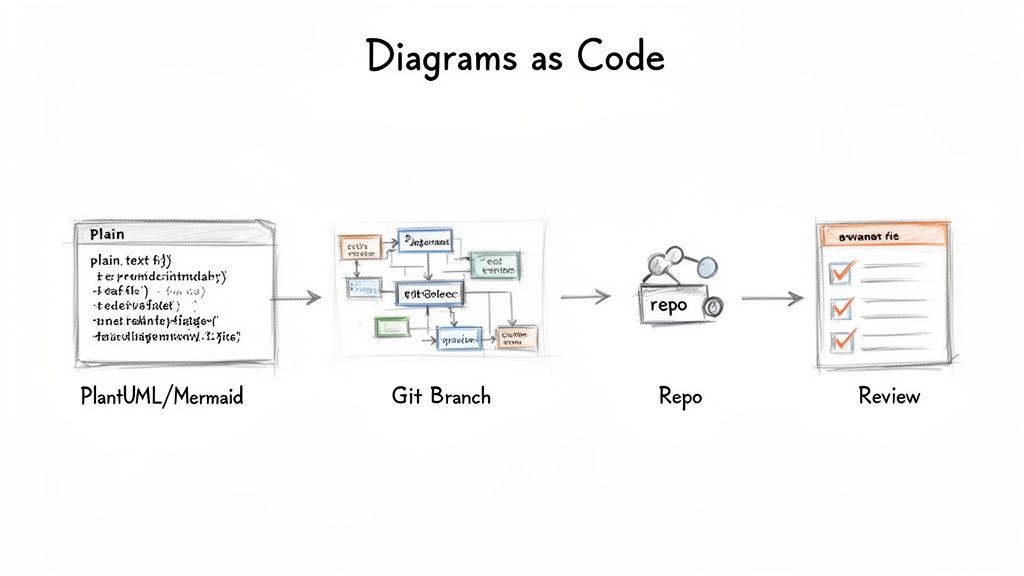
The Power of Diagrams as Code
Treat diagrams like code. Define diagrams in text files, store them in version control, and generate visuals automatically. Tools such as PlantUML and Mermaid enable this workflow, turning documentation into a version‑controlled, reviewable asset4.
When diagram definitions live alongside code, architectural changes go through the same pull request workflow as code changes. That makes diagrams a living part of development rather than an afterthought.
Integrating Diagrams into Your Workflow
Start by requiring diagram updates in the same commit that changes architecture. Benefits include:
- Versioned history of architecture changes.
- Automated generation and publishing via CI/CD.
- A single source of truth co‑located with the code.
This approach prevents stale documentation and keeps architectural conversations grounded in the codebase.
Weaving Diagrams into Daily Work
Make diagramming a routine part of development—like tests or PRs—so architecture stays current as the product evolves.
When to Create or Update Diagrams
Key moments to diagram include:
- Technical planning and RFCs: add a simple container or component diagram to clarify proposals.
- Before major refactors: create “before” and “after” diagrams to align the team.
- Onboarding: use high‑level context or container diagrams to speed new hires’ ramp‑up.
Where to Store Diagrams
Keep diagrams easy to find. Store diagram definitions in your repository README or a dedicated docs folder. For higher‑level views, use a team wiki or shared platform like Confluence or Notion. The goal is low friction—make checking the architecture as easy as checking the build status. Consider internal links to related docs such as /guides/c4-model, /guides/diagrams-as-code, or /services/architecture-audit to centralize architecture resources.
Using Diagrams for Code Audits and Refactoring
Diagrams help spot architectural smells—circular dependencies or services that have become monoliths. Comparing diagrams to code reveals drift and guides targeted refactoring.
AI‑Assisted Diagramming
AI tools can generate initial diagrams from code, which is valuable for legacy systems. But AI lacks the “why.” Use AI drafts as a starting point, then add business context and intent manually for a complete picture. Enterprise tools are increasingly integrating with development platforms, though adoption varies by team and region3.
Common Architecture Diagram Mistakes to Avoid
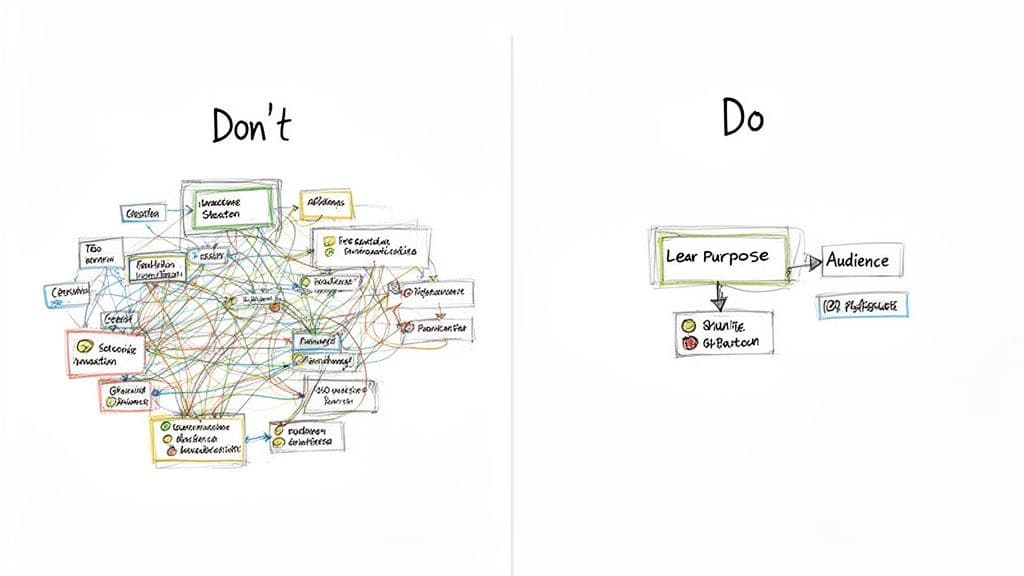
Avoid these frequent mistakes:
The Overly Complex “God” Diagram
A diagram that tries to show everything becomes unreadable. Give each diagram a single job and separate views for different audiences.
Vague Notation and Missing Keys
Every shape, line, and colour needs a defined meaning. A clear legend prevents misinterpretation and ensures diagrams scale beyond a single person’s memory.
Stale, Outdated Diagrams
Outdated diagrams mislead. Prevent this by treating diagrams as versioned artifacts alongside code. This “diagrams as code” method keeps architecture accurate and actionable.
Frequently Asked Questions
How often should we update diagrams?
High‑level Context diagrams change infrequently—perhaps once or twice a year. Container and Component diagrams should evolve with the code. The best practice is to update diagrams as part of feature work or refactors and automate generation in CI/CD pipelines.
What’s the difference between a diagram and a pattern?
A diagram is a concrete map of your specific system. A design pattern is a reusable concept (for example, Circuit Breaker). Your diagram may show where a pattern is implemented, but the pattern itself is an abstract idea.
Can AI tools automatically create architecture diagrams?
Yes. AI tools can scan code to produce initial diagrams, which is a huge time‑saver for legacy systems. However, human architects must add business context and strategic intent for the diagrams to be truly useful.
Quick Q&A: Practical Answers
Q: What diagram should I start with?
A: Start with a Context diagram to align stakeholders, then add Container diagrams for technical planning and Component diagrams for engineering detail.
Q: How do we keep diagrams from becoming stale?
A: Store diagram definitions in version control, require diagram updates in the same commit as architectural changes, and generate visuals via CI/CD.
Q: Which tools support diagrams‑as‑code?
A: PlantUML and Mermaid are popular choices; integrate them in CI pipelines to auto‑generate images and store definitions alongside code4.
At Clean Code Guy, we help teams align architecture with code through audits, diagrams‑as‑code, and pragmatic refactoring. Learn how we can help you keep diagrams current and actionable at https://cleancodeguy.com.
1.
Verified Market Research: Diagram software market valuation and adoption trends. https://www.verifiedmarketresearch.com/product/diagram-software-market/
2.
Survey findings on preferred C4 views and review frequency. https://www.verifiedmarketresearch.com/product/diagram-software-market/
3.
Enterprise architecture software market trends and regional share. https://www.coherentmarketinsights.com/industry-reports/enterprise-architecture-software-market
4.
Diagrams‑as‑Code tooling: PlantUML and Mermaid documentation. https://plantuml.com/ https://mermaid.js.org/
🙋🏻♂️
AI writes code.You make it last.
In the age of AI acceleration, clean code isn’t just good practice — it’s the difference between systems that scale and codebases that collapse under their own weight.