Create a clear software architect diagram that aligns your team and reduces tech debt. Learn practical steps, C4 model best practices, and the right tools.
December 30, 2025 (6mo ago)
Mastering the Software Architect Diagram A Practical Guide
Create a clear software architect diagram that aligns your team and reduces tech debt. Learn practical steps, C4 model best practices, and the right tools.
← Back to blog
Mastering Software Architecture Diagrams: A Practical Guide
Create a clear software architecture diagram that aligns your team and reduces tech debt. Learn practical steps, C4 model best practices, and the right tools.
Introduction
A clear software architecture diagram turns complex systems into a single source of truth that speeds onboarding, reduces technical debt, and keeps teams aligned. This guide shows practical steps to produce two high‑impact C4 diagrams, explains notation and scope, and recommends tools and processes to keep diagrams living and useful.
Why Clear Diagrams Are Your Team’s Secret Weapon
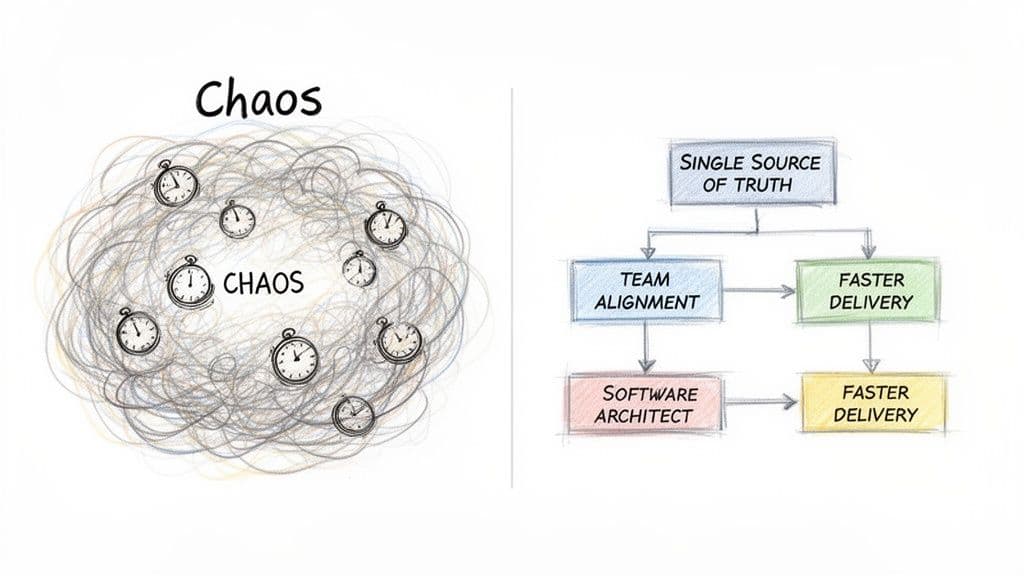
A software architecture diagram is more than boxes and arrows. It’s a strategic communication tool that prevents projects from descending into chaos and gives everyone, from developers to stakeholders to AI assistants, the same mental model. Without it, teams rely on tribal knowledge, which creates bottlenecks when people move on and drives up maintenance costs.
When teams lack clear diagrams, engineers waste time digging through code to understand dependencies. A 2023 study found developers lose a significant portion of their time to issues caused by poor documentation and unclear architecture1. The fallout shows up as:
- Slowed velocity, because engineers must reverse‑engineer the system before building features.
- Increased bugs, from hidden coupling and untracked dependencies.
- Ineffective onboarding, as new hires struggle to form a mental model.
- Misaligned teams, with product, design, and engineering working from different assumptions.
“A software architecture diagram transforms ambiguity into clarity,” and it becomes the foundation for clean code, maintainability, and faster delivery.
A Foundation for Clean Code and Scalability
Well-crafted diagrams accelerate refactoring and migrations. When a team decides to break a monolith into services or modernize a legacy stack, the diagram reveals dependencies and guides a migration strategy. When diagrams live alongside code, AI tools and human reviewers gain context that improves code generation and refactor suggestions.
This approach mirrors the practices we use on projects like lifepurposeapp.com and microestimates.com, where architectural clarity drives faster, safer development.
Choosing the Right Scope and Notation
Before drawing anything, answer two questions: “Who is this for?” and “What problem are we solving?” Diagrams must match their audience. A CEO needs a high‑level context view, while an engineer working on a feature needs a component diagram.
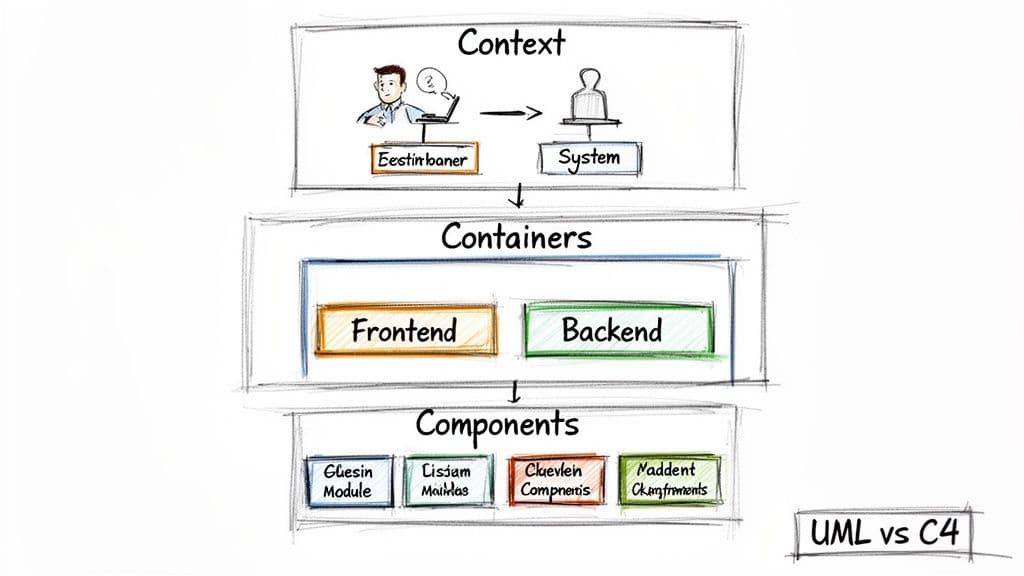
One scalable approach is the C4 model, which layers diagrams so you can zoom in when needed. The four levels are:
- Level 1: Context – A 10,000‑foot view showing the system, its users, and external systems.
- Level 2: Containers – The main deployable units and how they interact, such as a web app, API, and database.
- Level 3: Components – The internal structure of a container, like controllers, services, and repositories.
- Level 4: Code – Detailed class or implementation diagrams, usually generated by tools.
Architects increasingly trust the C4 approach; a recent survey shows strong confidence in its effectiveness, and Container diagrams are the most used by teams building microservices2.
Comparing C4 Levels and When to Use Them
| C4 Level | Primary Audience | Best For |
|---|---|---|
| Context (Level 1) | Business stakeholders, new hires | Onboarding, high‑level proposals, explaining what the system does |
| Containers (Level 2) | Architects, developers, DevOps | Defining boundaries, tech choices, initial design sessions |
| Components (Level 3) | Developers working on a service | Feature development, code reviews, local design decisions |
| Code (Level 4) | IDEs, code analysis tools | Deep debugging, automated documentation |
Most teams get the best ROI by starting with a Context diagram and a Container diagram.
C4 vs. UML for Agile Teams
UML is detailed and precise, but that precision can slow progress when architecture evolves quickly. C4 focuses on communication and clarity, making it easier for whole teams to adopt. Use UML only where formal, low‑level diagrams are necessary.
For example, in a stakeholder meeting use a Level 1 Context diagram. For planning how a new payment feature fits in, use a Level 2 Container diagram. For the developer building it, a Level 3 Component diagram is the practical guide.
Crafting Your First High‑Impact Diagrams

Start small and prioritise clarity. Your goal for the first pass is to capture boundaries and responsibilities, not every implementation detail.
Sketching the System Context Diagram (Level 1)
A System Context diagram should be understandable in under a minute. Treat the application as one black box, show the main users and the external services it depends on. For a modern web app, the diagram might show “Customer” and “Admin” actors, and external systems like an authentication provider, a payment gateway, and an email service.
This simple view aligns stakeholders quickly and prevents scope misunderstandings.
Zooming into the Container Diagram (Level 2)
A Container diagram breaks the system into major deployable pieces. For a typical stack:
- Next.js Web App — the frontend user interface.
- Node.js API — backend business logic and orchestration.
- PostgreSQL Database — primary persistent store.
Draw connections between these containers and the external systems from your Context diagram. This stage forces early answers to important questions, like whether the frontend should call a payment gateway directly or go through the API.
Essential Tips for Clarity and Impact
Consistency and simple labeling make diagrams useful.
- Use clear names for boxes and arrows, for example “Sends user data to.”
- Add technology choices, e.g., “API (Node.js).”
- Keep shapes and colors consistent so diagrams are scannable.
These visual habits reflect clean code principles and pay dividends in maintainability and developer productivity.
Finding the Right Tools for Your Team
Choose tools that fit your workflow, balancing collaboration and maintainability. Tools fall into two camps: visual editors and diagrams as code.
Visual Diagramming Tools
Drag‑and‑drop editors like Lucidchart, Miro, and Diagrams.net are ideal for collaborative brainstorming and high‑level presentations. They’re great for live whiteboarding and stakeholder sessions, but because diagrams live outside the codebase they can go stale without process.
Diagrams as Code
Text‑based tools like Mermaid.js, PlantUML, and D2 let you keep diagram source files in Git. When diagrams live with your code, updates become part of the normal workflow, which prevents documentation drift.
A hybrid approach often works best: use visual editors for ideation and diagrams‑as‑code for the versioned, reviewable source of truth.
Tool Comparison
| Tool | Best For | Learning Curve |
|---|---|---|
| Lucidchart / Miro | Collaborative brainstorming, non‑technical audiences | Low |
| Diagrams.net | Free, quick diagrams | Low |
| Mermaid.js | Diagrams in Markdown/Git | Low to Medium |
| PlantUML | Complex UML and C4 diagrams as code | Medium |
| D2 | Declarative diagrams as code with smart layout | Medium |
Pick what your team will actually use consistently.
Making Diagrams a Living Part of Your Culture
Embed diagrams into your processes so they stay current:
- Make diagrams part of the pull request, required for architectural changes.
- Establish a single source of truth, for example a /docs folder in the main repo.
- Use diagrams for onboarding, giving new hires a fast path to system understanding.
- Pull diagrams into planning meetings to keep them relevant.
When diagrams become part of everyday work, they stop being a one‑off deliverable and become an essential communication tool.
Keeping Diagrams Alive with Code and AI
Treat diagrams like code. Update them in the same ticket as the related code change so they stay accurate. That discipline prevents stale diagrams from misleading teams and causing rework.
Championing Diagrams as Code
Store diagram definitions in the repository so they’re versioned with the code. This provides:
- Version control and history, so you can see why diagrams changed.
- Automated review, because diagram updates are included in PRs.
- A single source of truth, where developers know where to look.
Integrating Diagrams with AI Workflows
Machine‑readable diagrams become inputs for AI tools. When an AI pair programmer reads a C4 diagram, it understands boundaries and components and can generate more accurate code or suggest smarter refactors. Diagrams thus transform from documentation into active assets for development.
The Business Impact of Live Documentation
Current practices show measurable benefits. Teams that keep architecture documentation current reduce onboarding time and improve alignment across the enterprise. For example, clear architecture diagrams have been linked to faster onboarding and better enterprise alignment in industry reports and government frameworks43.
Regular architecture reviews, such as a standing agenda item in sprint planning or a bi‑weekly sync, help prevent drift and technical debt.
Common Questions About Software Architecture Diagrams
How Often Should We Update Our Software Architecture Diagrams?
Update diagrams when significant architectural changes occur. High‑level Context diagrams need quarterly reviews, while Container and Component diagrams should be updated alongside code changes and included in PRs.
What’s the Biggest Mistake Teams Make When Starting?
Trying to document everything at once. That leads to diagrams that are hard to maintain. Start with Context and Container diagrams to capture the biggest risks and boundaries first.
Can Diagrams as Code Tools Replace Visual Editors?
Not entirely. Use visual editors for fast, collaborative brainstorming and diagrams‑as‑code for versioned, developer‑focused documentation. A hybrid approach is often best.
Quick Q&A
Q: What diagrams should we create first?
A: Start with a Level 1 Context diagram and a Level 2 Container diagram. They give the most value with the least effort.
Q: How do we keep diagrams from going stale?
A: Store diagram source files in Git, require updates in PRs, and make architecture reviews part of your regular process.
Q: Which tools should developers use?
A: Use Mermaid.js, PlantUML, or D2 for versioned diagrams in repos. Use Lucidchart or Miro for collaborative brainstorming.
At Clean Code Guy, we help teams turn these practices into habits so architecture becomes a durable asset. If your codebase feels tangled, a targeted Clean Code Audit can map a practical refactoring plan that works.
1.
Mural, “The Value of Visual Collaboration,” https://www.mural.co/blog.
2.
State of Software Architecture 2024, Icepanel, https://icepanel.io/blog/2024-11-26-state-of-software-architecture-2024.
3.
California Enterprise Architecture Framework (CEAF), California Department of Technology, https://cdt.ca.gov/services/wp-content/uploads/sites/2/2020/10/CA-Enterprise-Architecture-Framework-Views.pdf.
4.
Atlassian, “Why documentation matters for team onboarding and handoffs,” https://www.atlassian.com/blog/productivity/documentation-benefits.
🙋🏻♂️
AI writes code.You make it last.
In the age of AI acceleration, clean code isn’t just good practice — it’s the difference between systems that scale and codebases that collapse under their own weight.